![]()
Raven
Poetry Analysis Data Sculpture, December 2015

Raven is a data sculpture that explores two questions: 1. How do you quantify art as data? and 2. What would it look like to physicalize a poem? Using Edgar Allan Poe’s The Raven as my starting point and the book that contains this work, “The Complete Tales and Poems of Edgar Allan Poe” as the material, I sought out a way to construct a sculptural data visualization that would give form to an art that consists only of words.


I went to work in analyzing literary elements of the poem, focusing on elements that make for structural composition. For reference I found the poedecoder helpful, and The Philosophy of Composition by Edgar A. Poe himself. In this book, Poe writes: “I select “The Raven,” as most generally known. It is my design to render it manifest that no one point in its composition is referrible either to accident or intuition — that the work proceeded, step by step, to its completion with the precision and rigid consequence of a mathematical problem.” This point was perfect in how I wanted to approach the analysis as a breakdown of numbers.

To attain the numerical data, I did a manual analysis of poetic elements, namely data regarding alliteration, repetition, and rhyme, organized according to the structure of stanzas, lines, and syllables.

The poem consisted of 108 Lines, 6 lines per stanza, and 18 stanzas. The book also happened to be bound in 18 packets of paper. I decided to keep that number 18 as the amount of contained shapes I would cut, and do a per stanza analysis, focusing on rhyme scheme, alliteration, and repetition. Rhythm: 16,15,16,15,15,7 syllables
For the detailed dataset of all 18 stanzas, refer to the excel documents attached at the bottom. Also attached is my methodology of converting alliteration sounds to numbers, based on a phonological analysis of consonant sounds. As for repetition, I kept a count on how many times certain words or phrases are repeated in the poem, as well as how many syllables it consists of. Then I divided the syllable count from the repeated amount, and let the graph represent those values in an additive way (hence, the repetition never drops down, only goes up by a certain increment, and then resets each start of stanza).

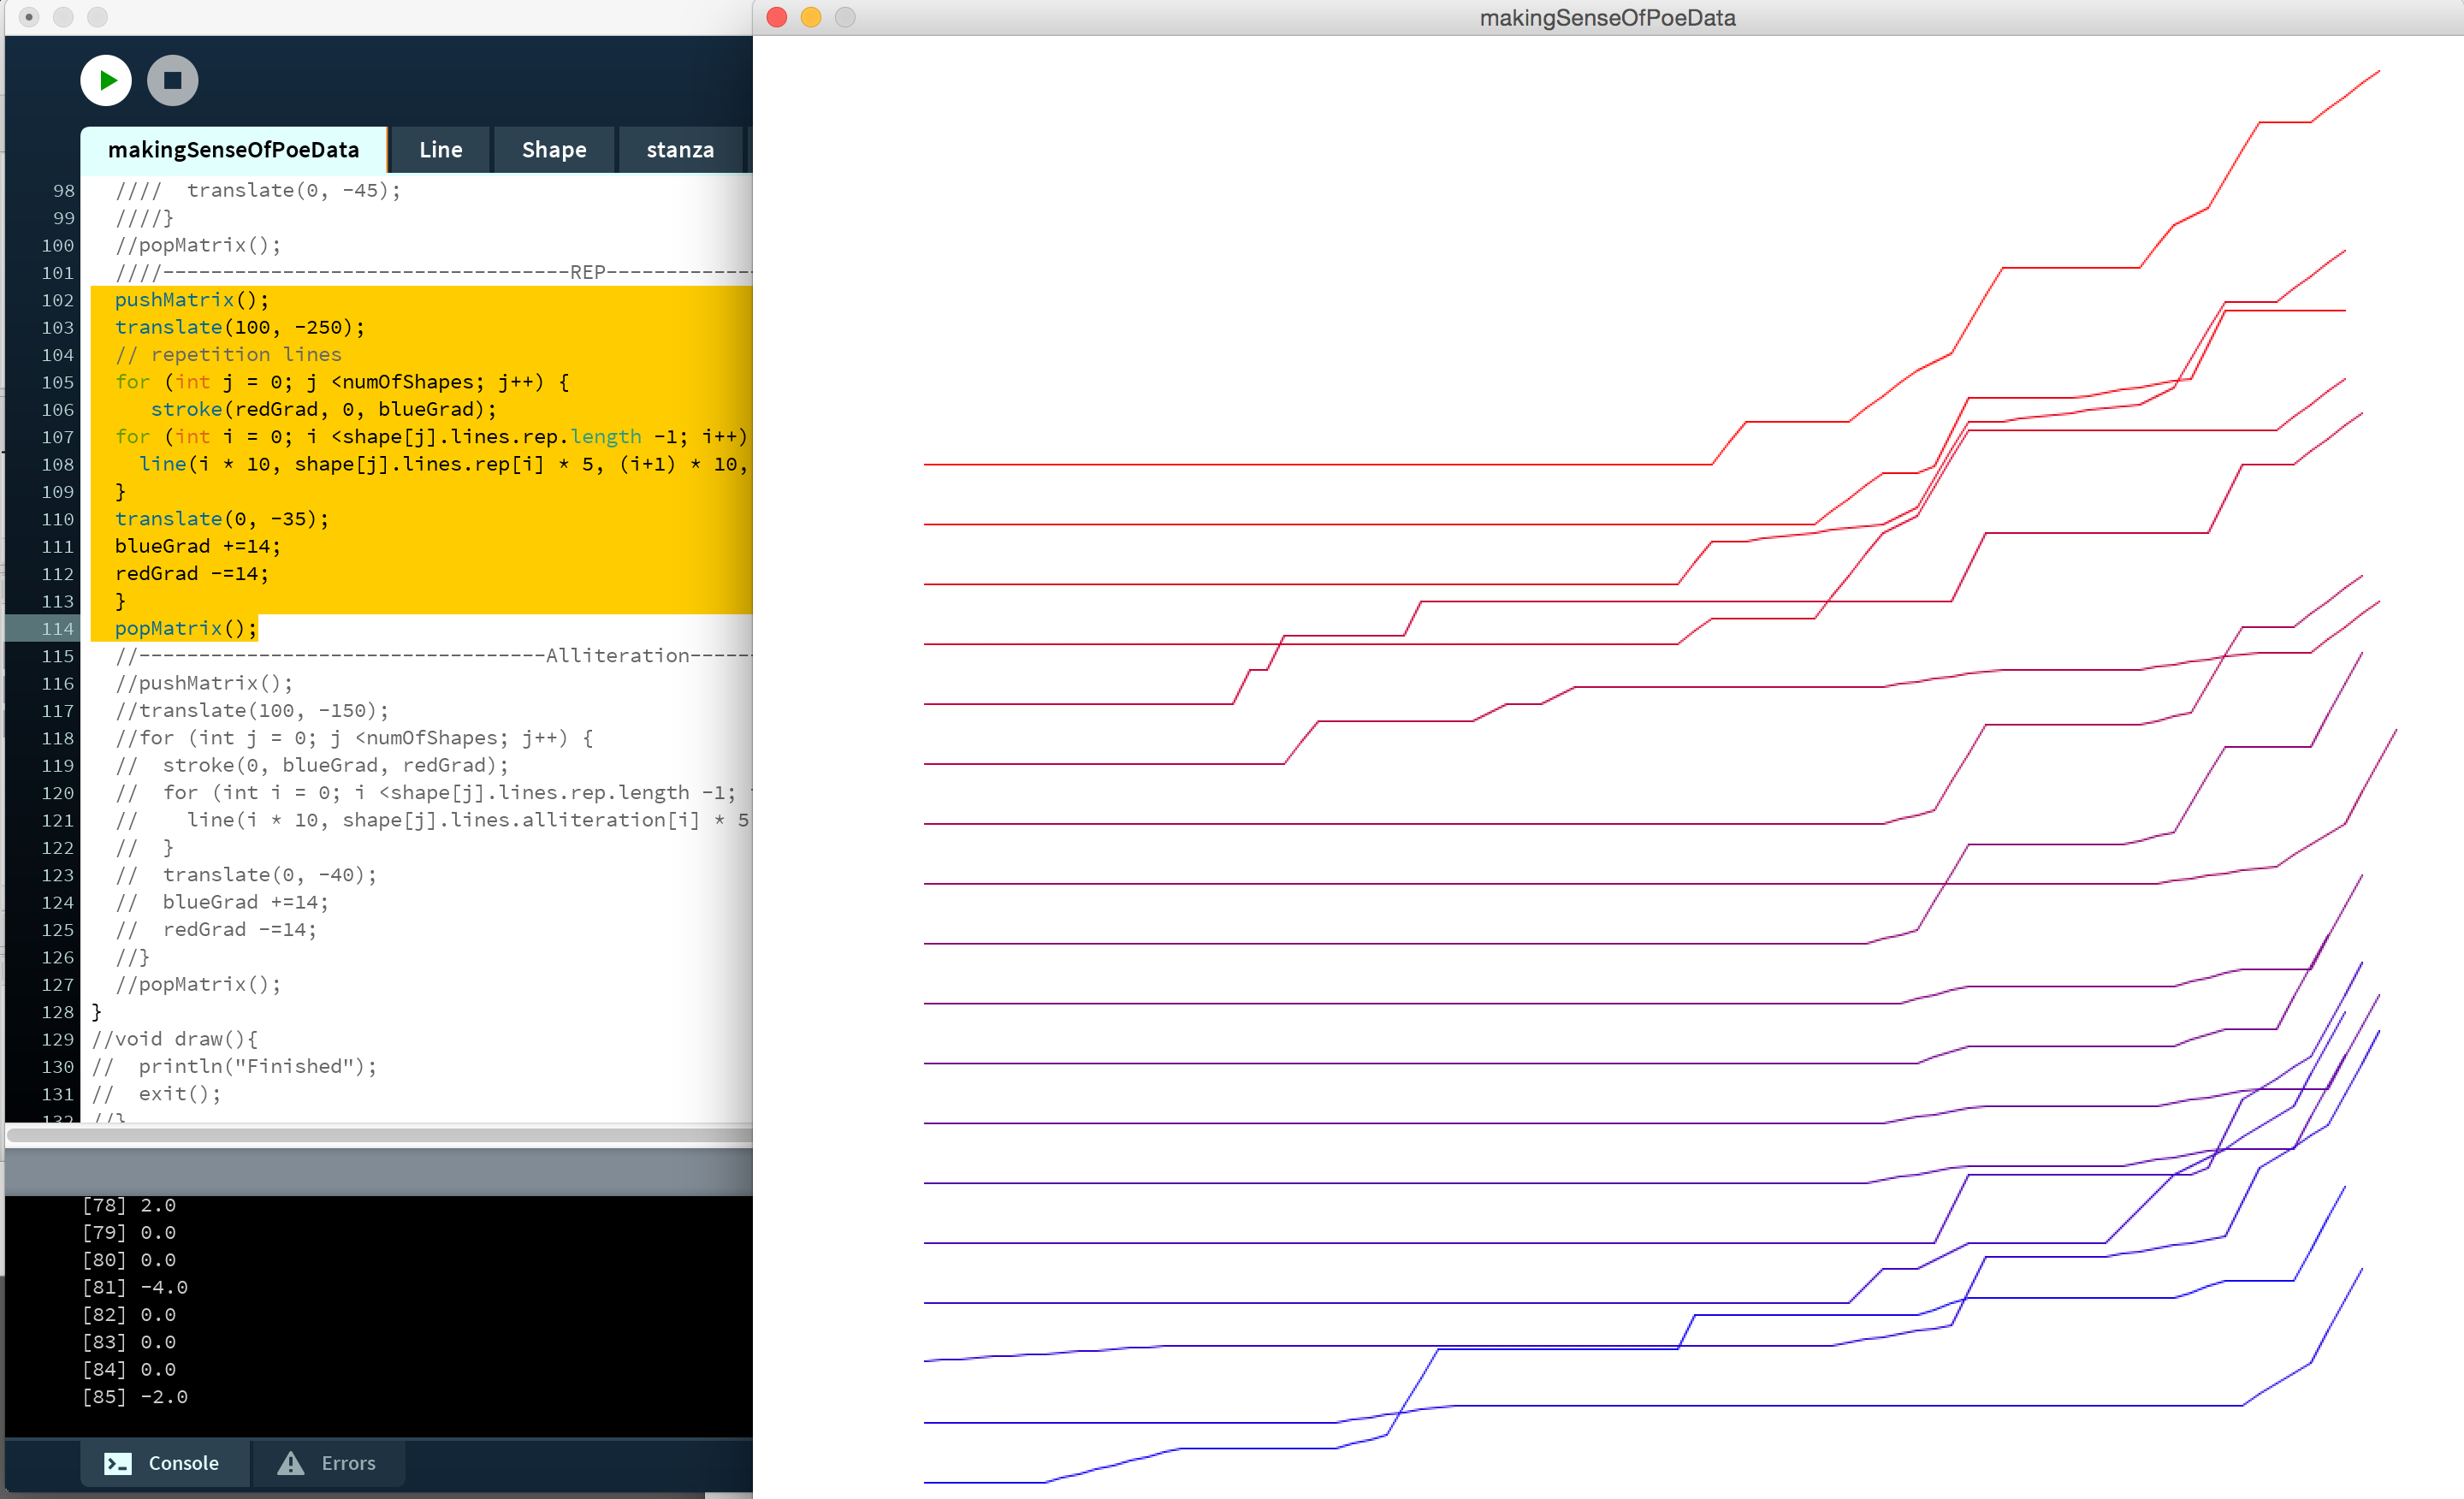
I then took that dataset into processing and visualized the data in lines.
Repetition data:
Alliteration data:
Rhyme scheme data: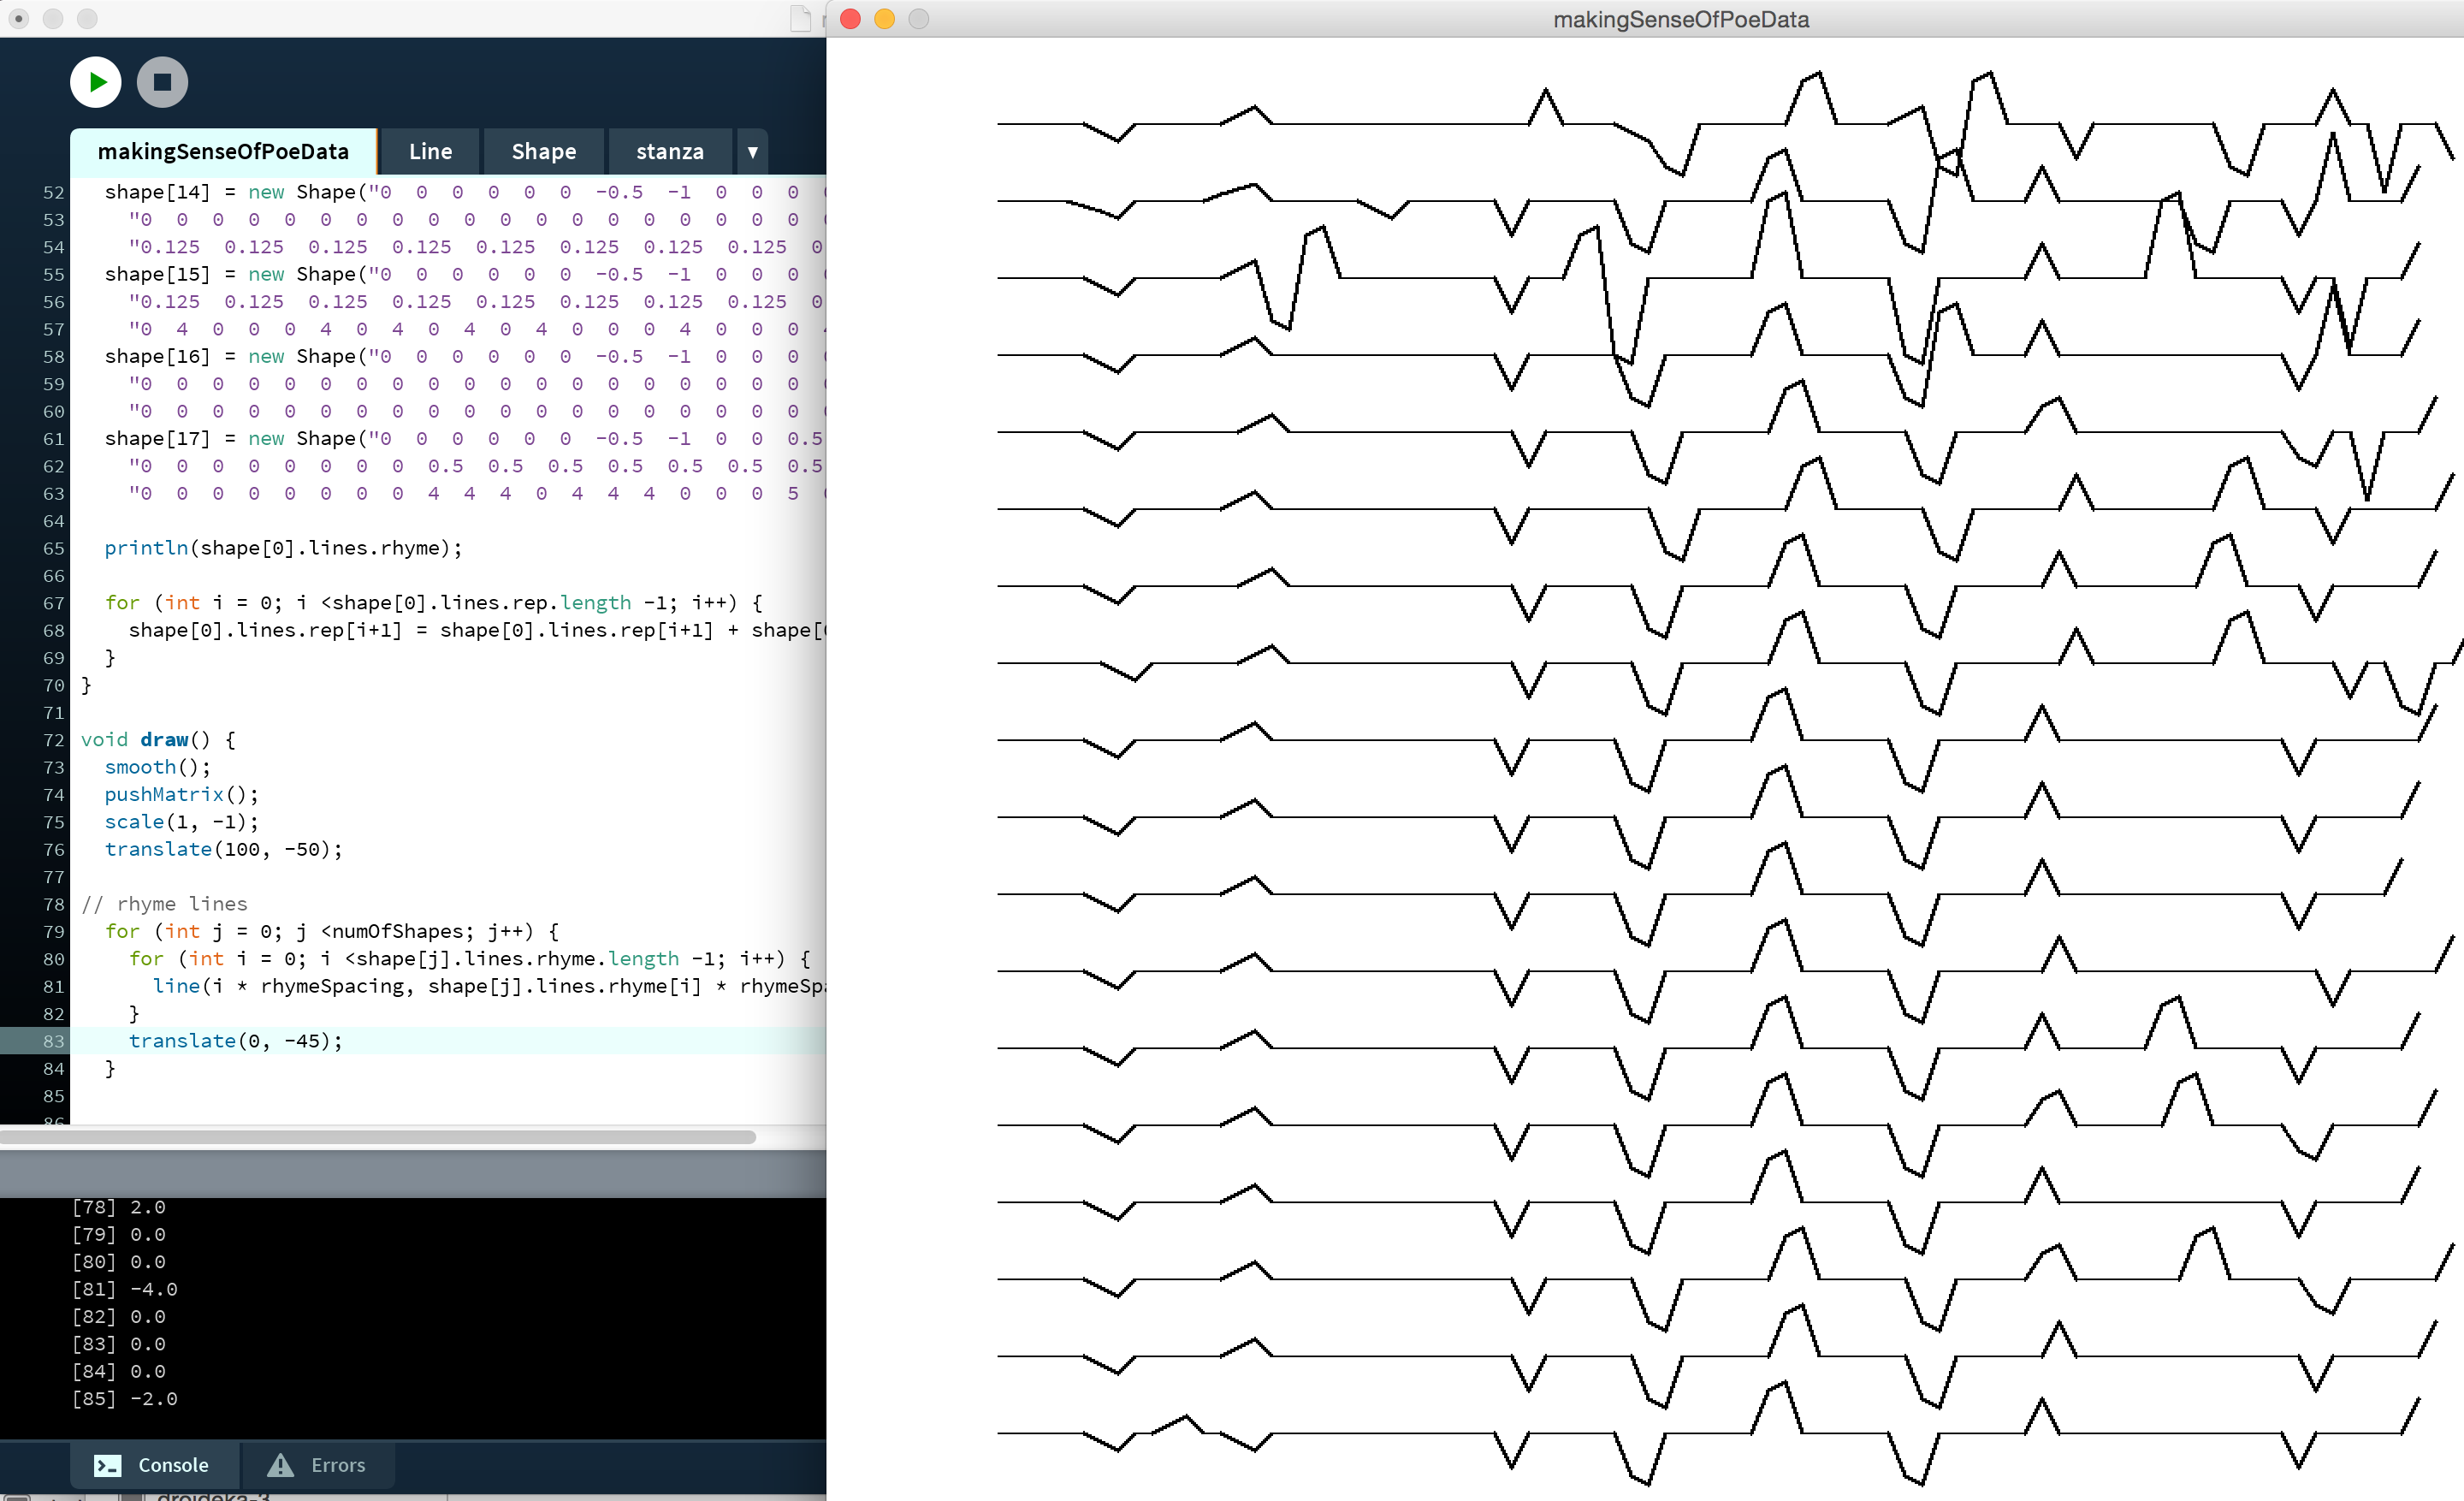
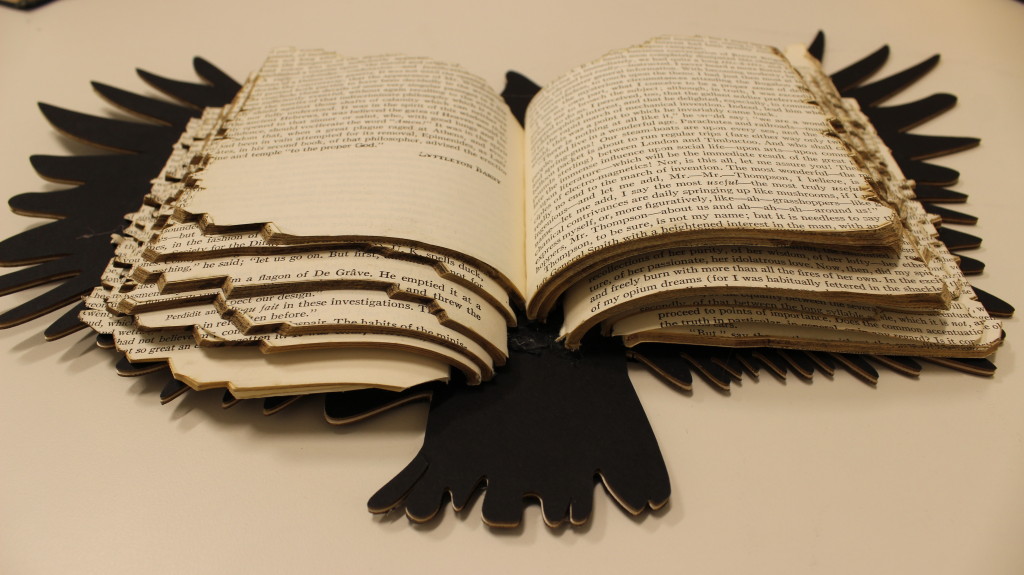
Then, I took those three lines that compose each stanza shape and arranged it so that the top part of the page from left to right shows alliteration (the most drastic sloping shape), the top to down edge of the page shows rhyme scheme (as you would typically find the rhyme on the ending syllables of lines within a stanza), and the bottom part of the page from left to right shows the repetition.

The bird shape was designed as the book cover. I took the output of the data as the guide to the shape (making sure to avoid the other way around. I didn’t want a preconception of a shape to guide the data).


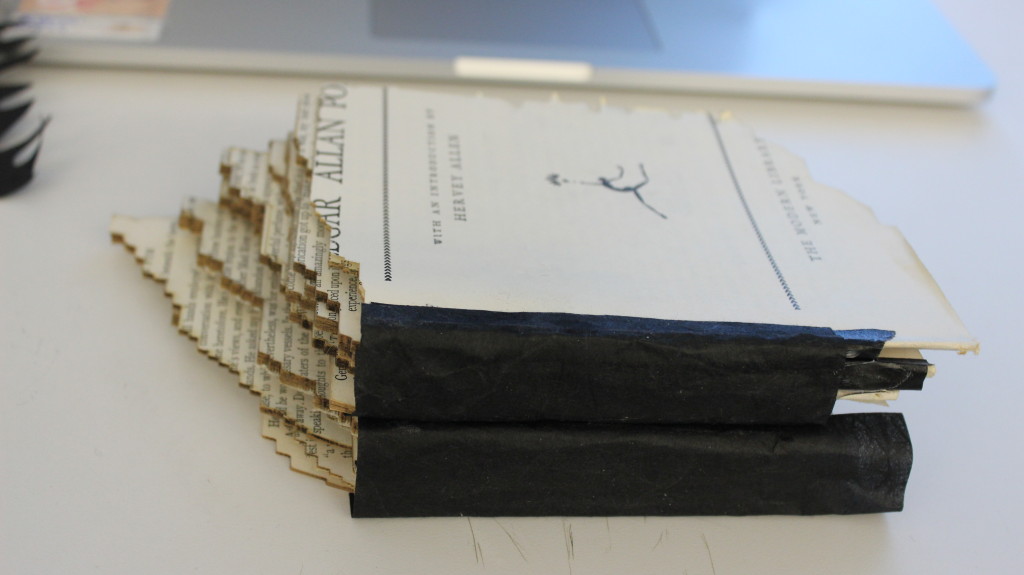
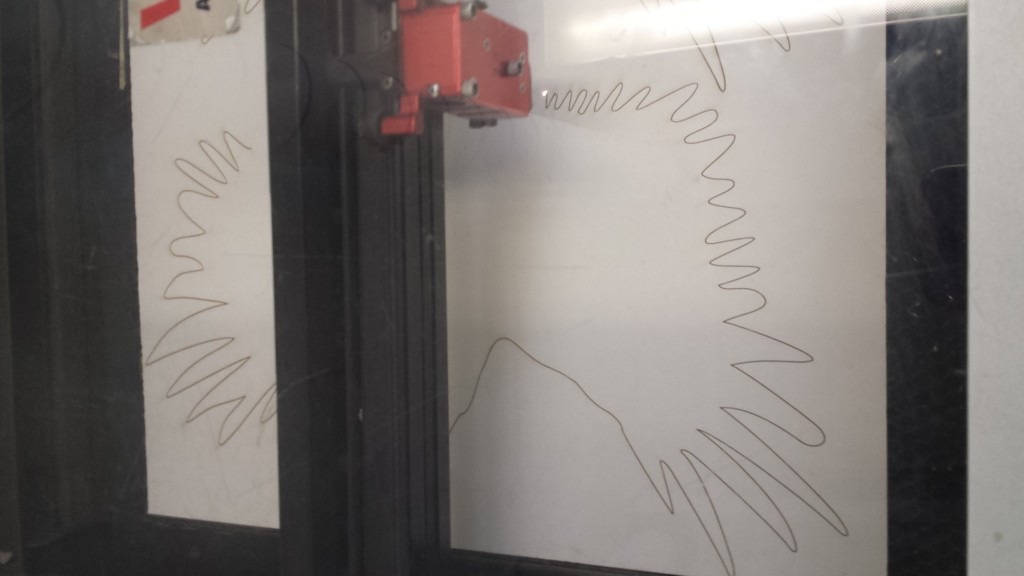
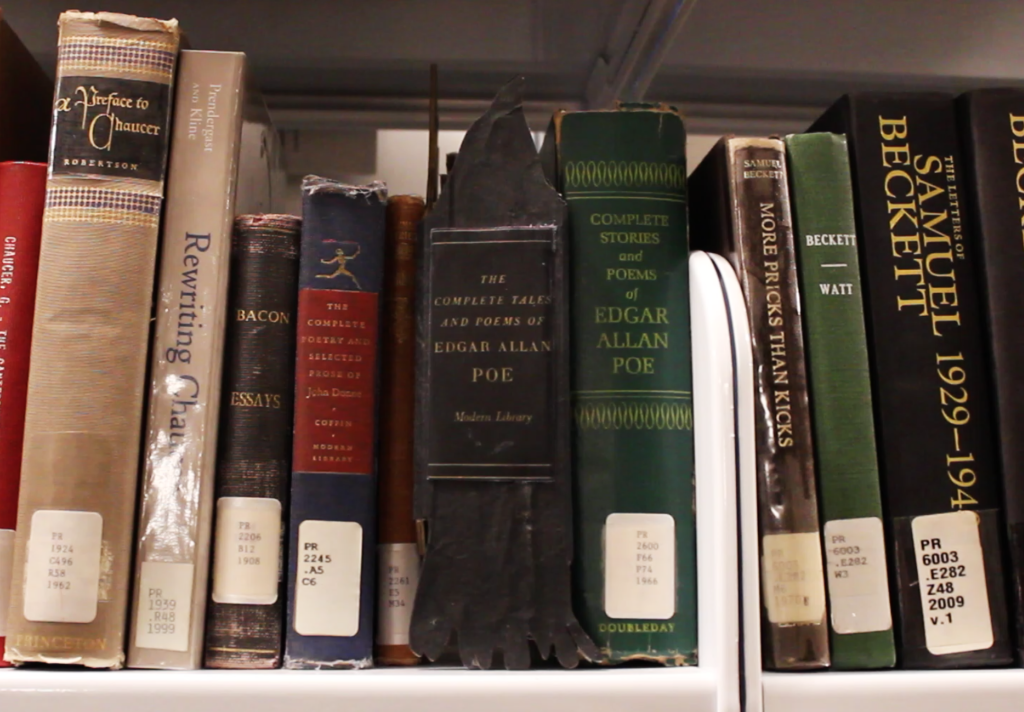
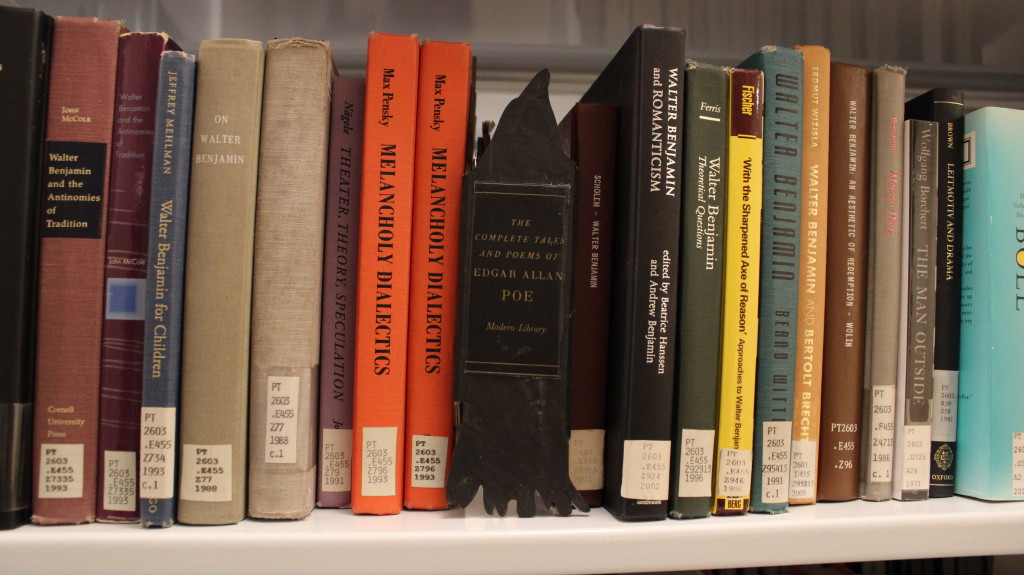
I laser cut all 18 layers of the book as well as the book cover and bound them back up.


And let the bird book live in the library next to its kin for a while.